IBM
QRadar UBA
What is QRadar UBA?
QRadar UBA
IBM Security QRadar UBA helps you proactively monitor and respond to internal threats from an integrated perspective.
Analyzing user behavior abnormalities, detecting compromised confidential information or malware, through comprehensive data sets and Sense Analytics
Suspicious users are detected and information asset monitoring is visualized through a dashboard.
Why UBA?
The need for QRadar UBA
Product introduction
Product Features
detect
analyze
1. Detect suspicious users with comprehensive data sets and Sense Analytics


- Pattern recognition
- User and entity profiling
- statistical analysis
- Anomalous detection
- business context
- Entities and user context
- External threat correlation analysis
- Historical analysis
- Real-time analysis
- threat hunting
- Threshold-based rules
Product introduction
Main features
IBM User Behavior Analytics dashboard
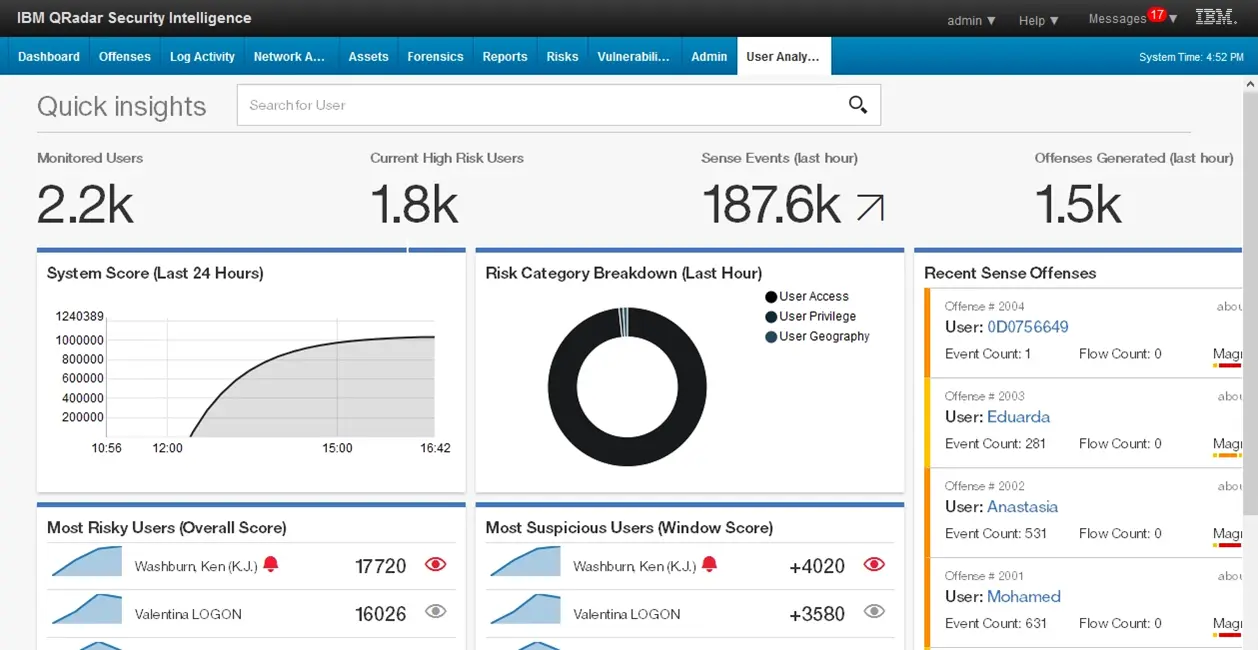
[User behavior risk trends]
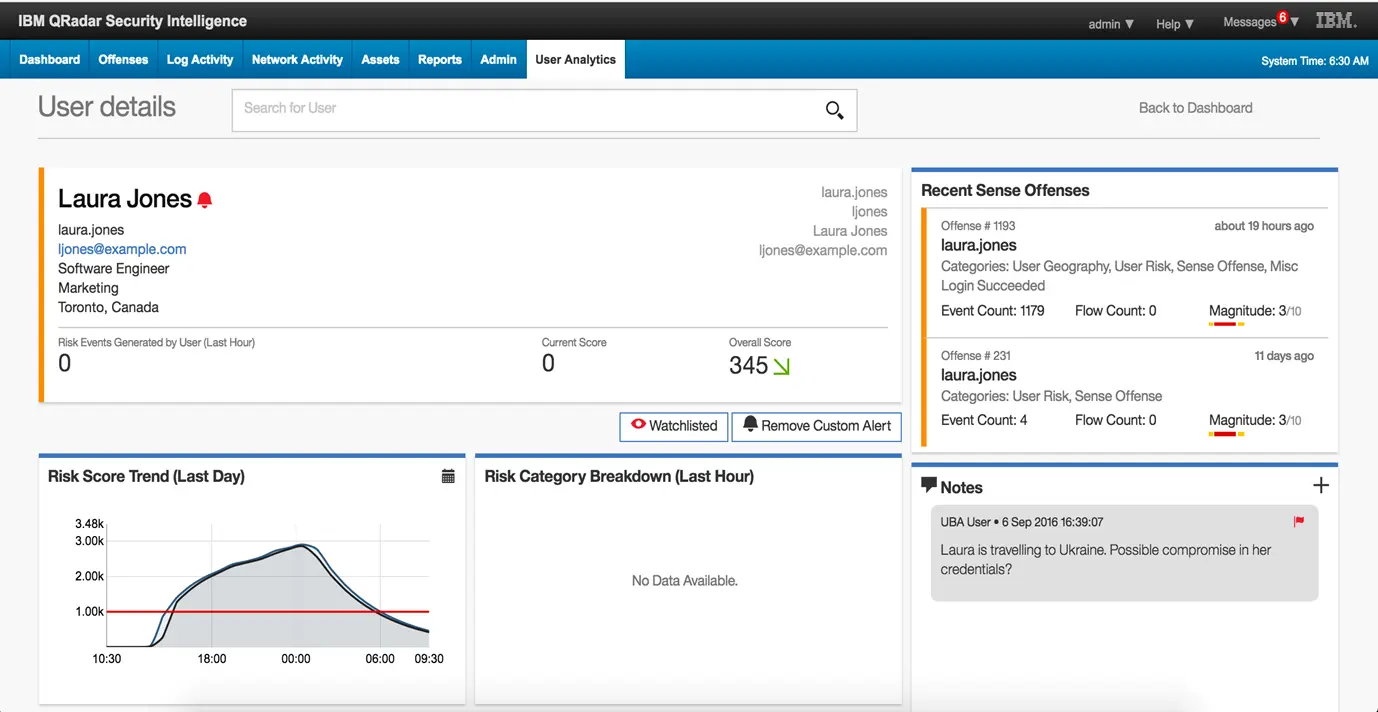
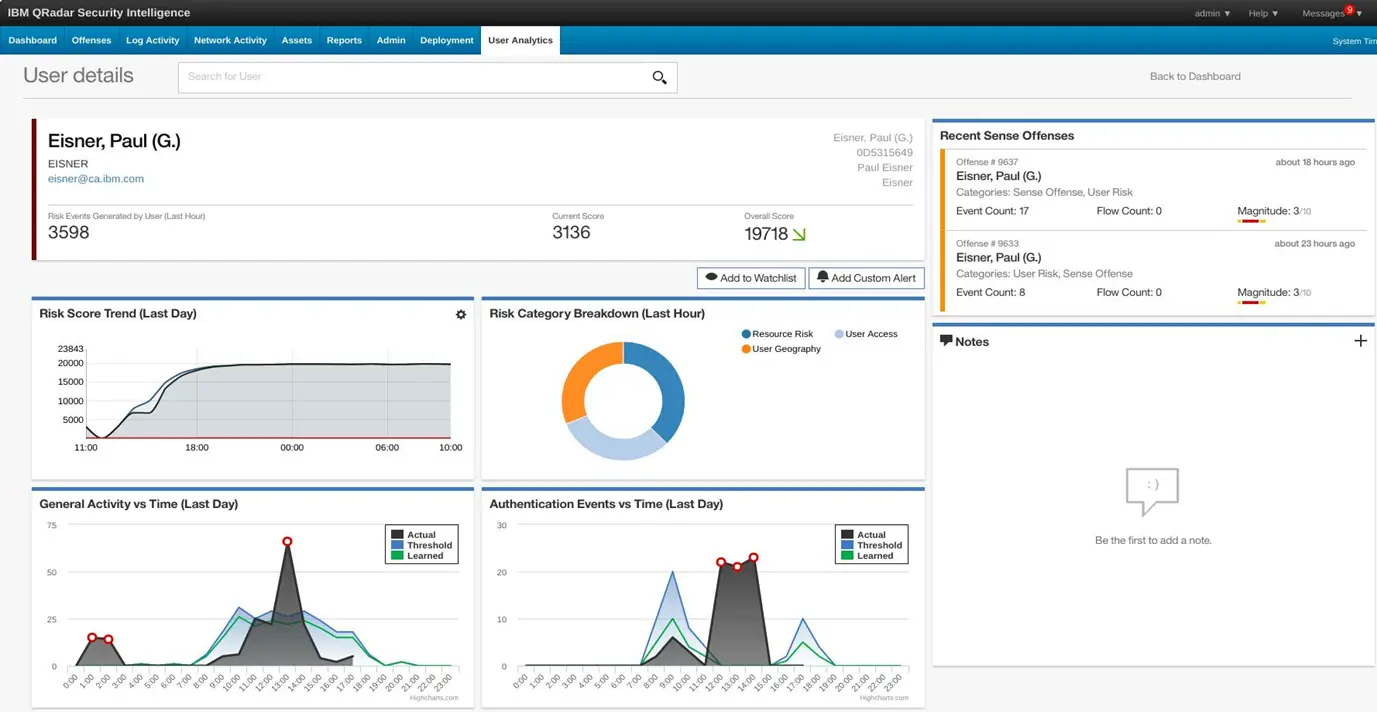
[Individual user details]
Visualization of user behavior distribution - machine learning application
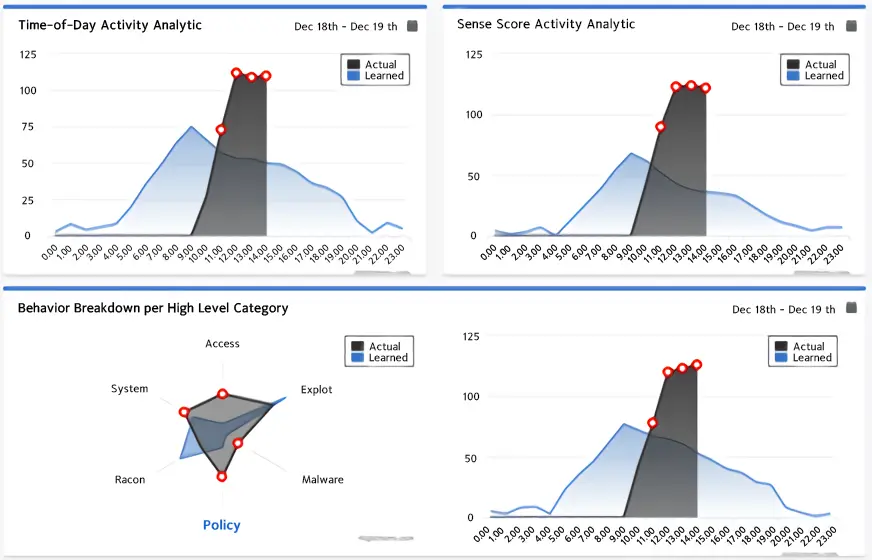
Create statistical models of individual user behavior and then identify the number and timing of unusual actions or changes in specific categories of events.
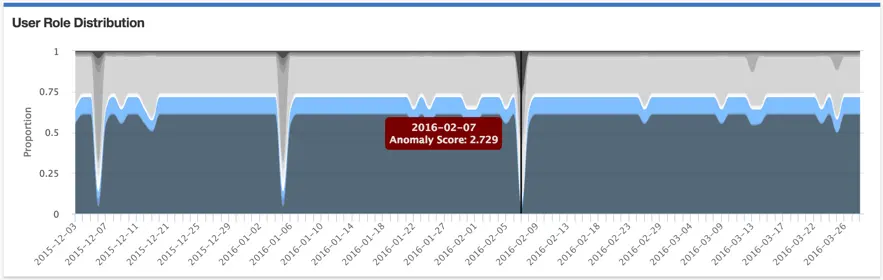
Through monitoring user behavior, the index of the role held by the user is identified. In the picture above, each color represents a different role. The index deviation of individual roles is an increase or decrease in the distribution of user roles, making it easy for analysts to identify strange actions used even when unnecessary.
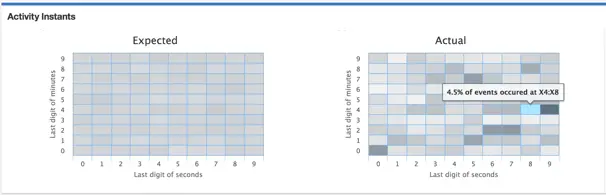
This analytics model models the immediate onset of user behavior, predicting that normal user behavior will be relatively consistent across seconds on the minute scale and minutes on the hour scale. If abnormal behavior is repeated at regular intervals, it is displayed as a hotspot (dark area) as shown in the picture on the right above.
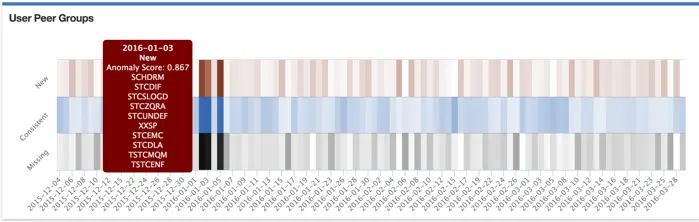
User peer groups can be identified by an index of roles or a defined set of roles. These peer groups are utilized to identify whether the user's behavior has changed. This identification is indicated by the dark bands in the picture above, with red representing the dominance of new peers and dark black representing lost peers.
Product introduction
expected effect
Increase SOC Analyst Productivity

- Provides a menu for easy access to internal data sources and threat intelligence

- Download and install the app quickly (free for QRadar customers)

- Reduces the burden of acquiring and acquiring the skills required to use the product
Effects of using machine learning
Analyze trends in risk scores over time
If the risk score increases or decreases differently than usual, the user's risk score is analyzed in detail based on this.
Learn based on your users
by Category
Divide learning into high-level categories of 18+
Distribution
Learn by dividing into categories
Analyze it to find similar categories or
Estimate peer group based on